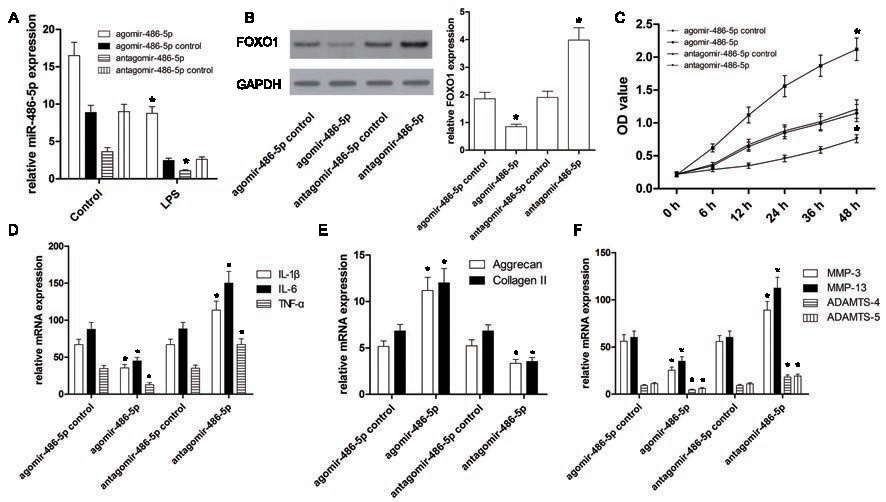
Fig. 3. The effects of miR-486-5p on LPS-induced inflammation and ECM loss of NP cells. (A) NP cells were transfected by the agomir-486-5p or antagomir-486-5p, respectively, followed by LPS stimulation. Expression of miR-486-5p was measured by qRT-PCR. (B) The bands of FOXO1 protein were analyzed by Western blot, and measured by densitometry with Quantity One quantitation analysis software package. (C) The viability of NP cells was measured by CCK-8. (D) qRT-PCR validated the mRNA expressions of inflammatory cytokines in LPS-treated NP cells with agomir-486-5p or antagomir-486-5p; GAPDH was used as an internal control. (E,F) qRT-PCR validated the mRNA expressions of ECM genes and matrix degrading enzymes in LPS-treated NP cells with agomir-486-5p or antagomir-486-5p. Each experiment was assayed in triplicate independently. Data was represented as means ± SD. *P<0.001, v.s. control.